I. Convergence vs. Persistent Dispersal
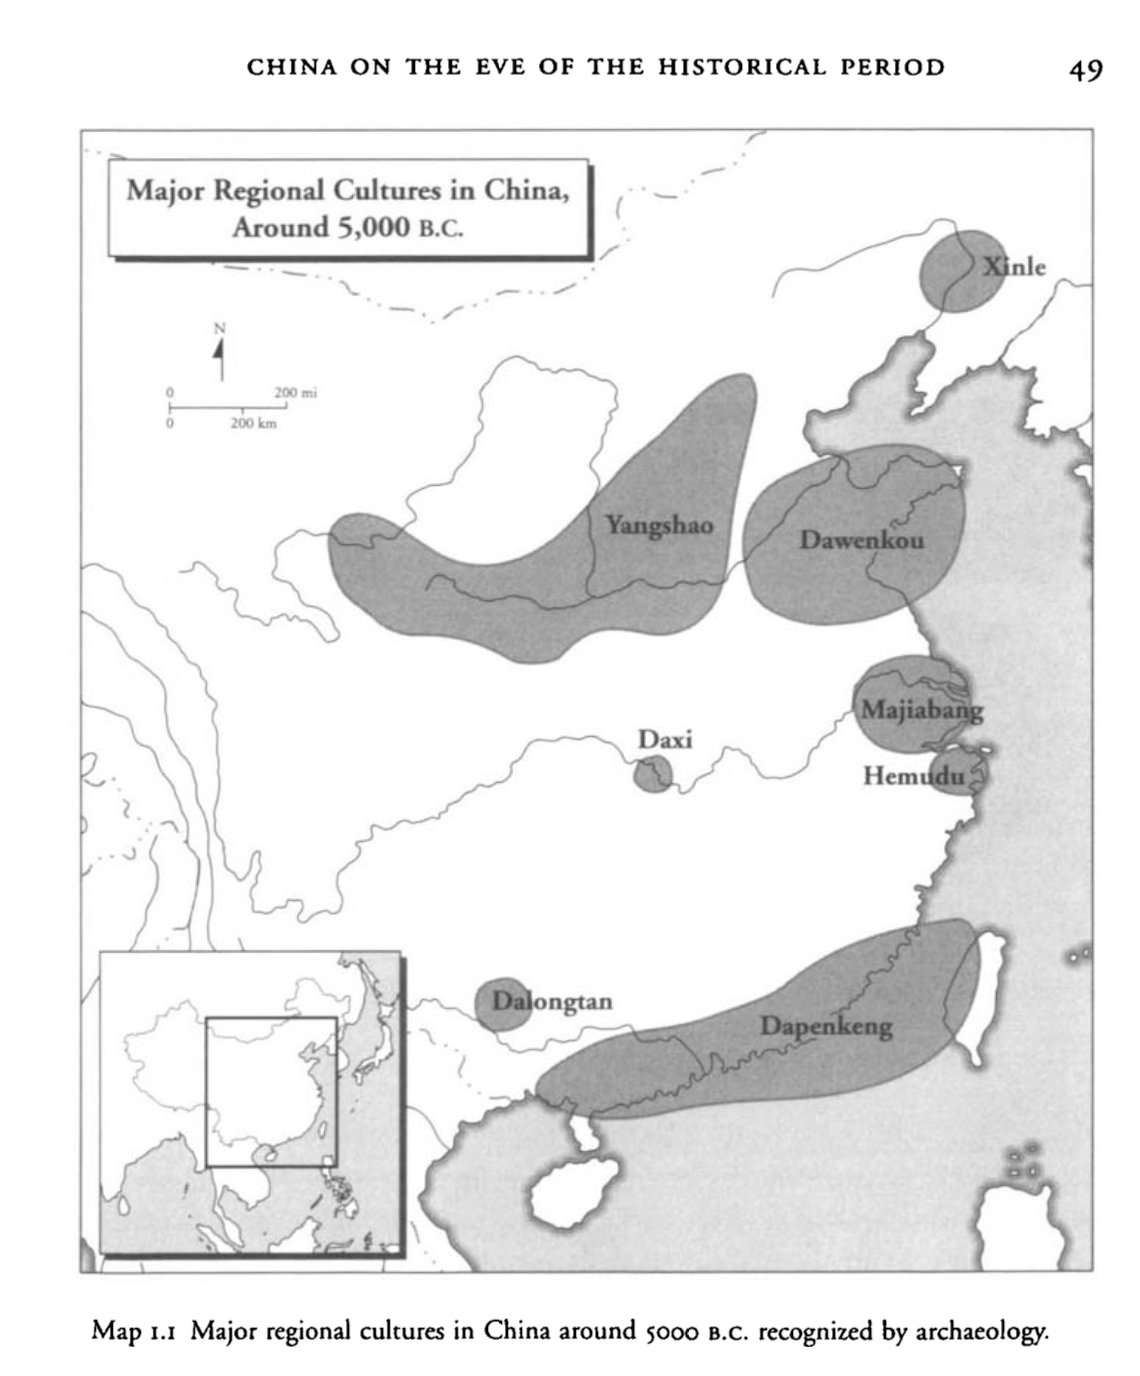
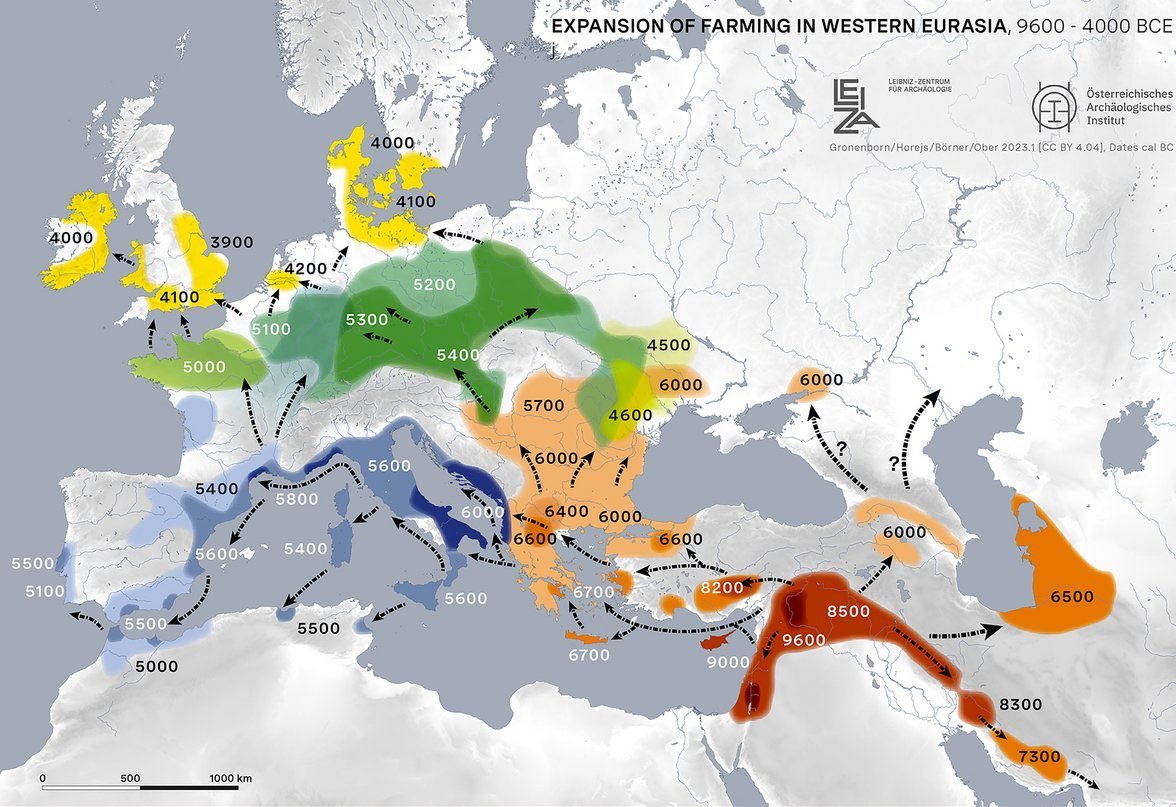
The conventional framing of Chinese geographic unity vs. European fragmentation can mislead if applied too early. At 5000 BCE, China was at least as multi-polar as Europe. K.C. Chang's Map 1.1 (Cambridge History of Ancient China, p. 49) identifies seven or more distinct regional cultures: Yangshao in the Wei valley, Dawenkou in Shandong, Xinle in Manchuria, Daxi in the middle Yangtze, Majiabang and Hemudu in the lower Yangtze, and Dalongtan/Dapenkeng in the far south. Europe at the same date had three to four separated farming zones (Balkans, the Danube/LBK corridor, the Mediterranean coast, and emerging Iberian settlement). If anything, China appeared more dispersed.
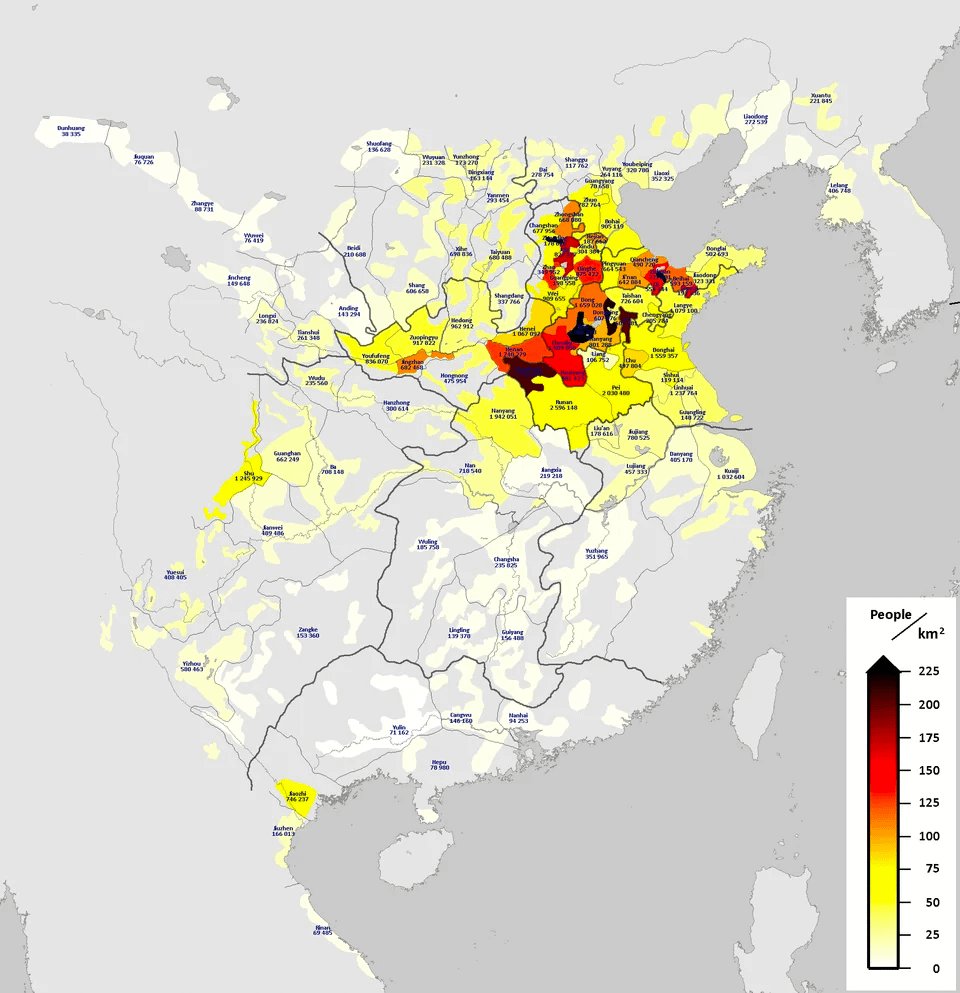
The critical difference is what happened between 5000 and 1000 BCE. In China, one zone (Yangshao → Longshan → Erlitou → Shang → Zhou) became overwhelmingly dominant and progressively absorbed or displaced the others. By the Han census of 2 AD, this single core on the Yellow River plain held the vast majority of a 60-million population. The other Neolithic cultures either merged into the expanding core, retreated to peripheries, or contributed ancestry that was subsumed. This is a process of convergence: many centers collapsing into one.
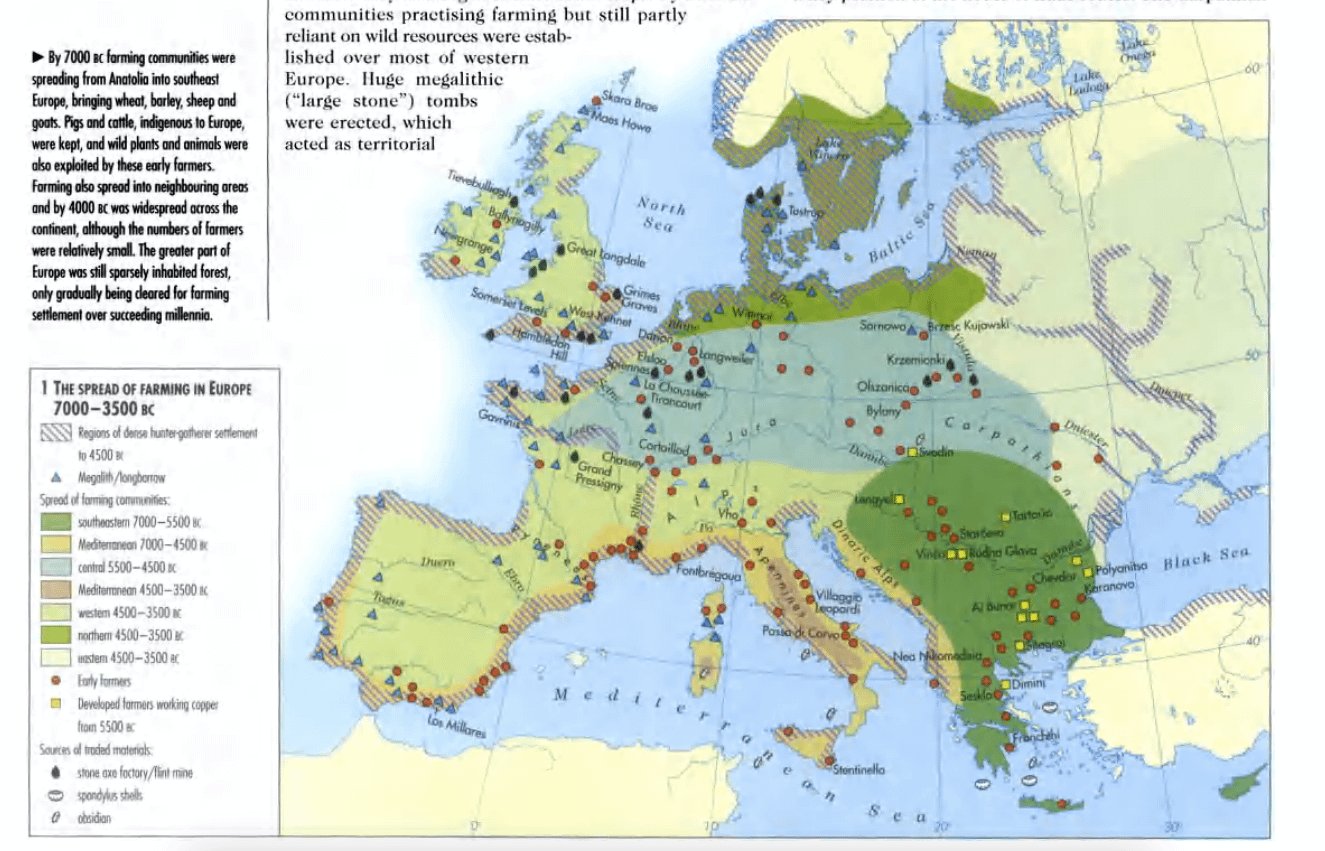
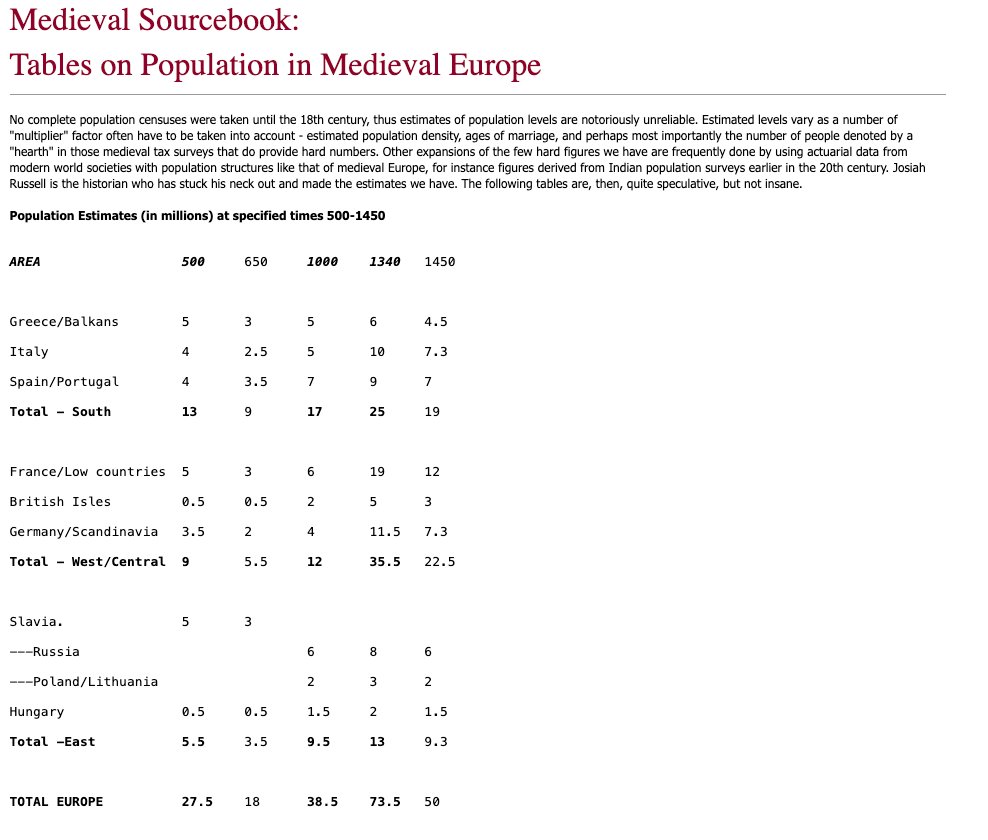
In Europe, no analogous process occurred. The Balkans, Italy, Iberia, Gaul, the Rhine zone, and Britain all persisted as roughly co-equal population centers across every subsequent period. The Mediterranean, the Alps, the Pyrenees, and the English Channel kept them separated. European farming itself hugged coasts and river valleys for millennia; interior Germany was heavily forested until the High Medieval Rodung clearing. The three-field system that transformed northern European agriculture after ~800 AD actually created additional population centers (in the Paris basin, the Rhineland, and southern England) rather than consolidating existing ones. Rome temporarily governed all these regions, but the demographic structure underneath remained multi-polar, and when Rome fell, fragmentation reasserted itself immediately.
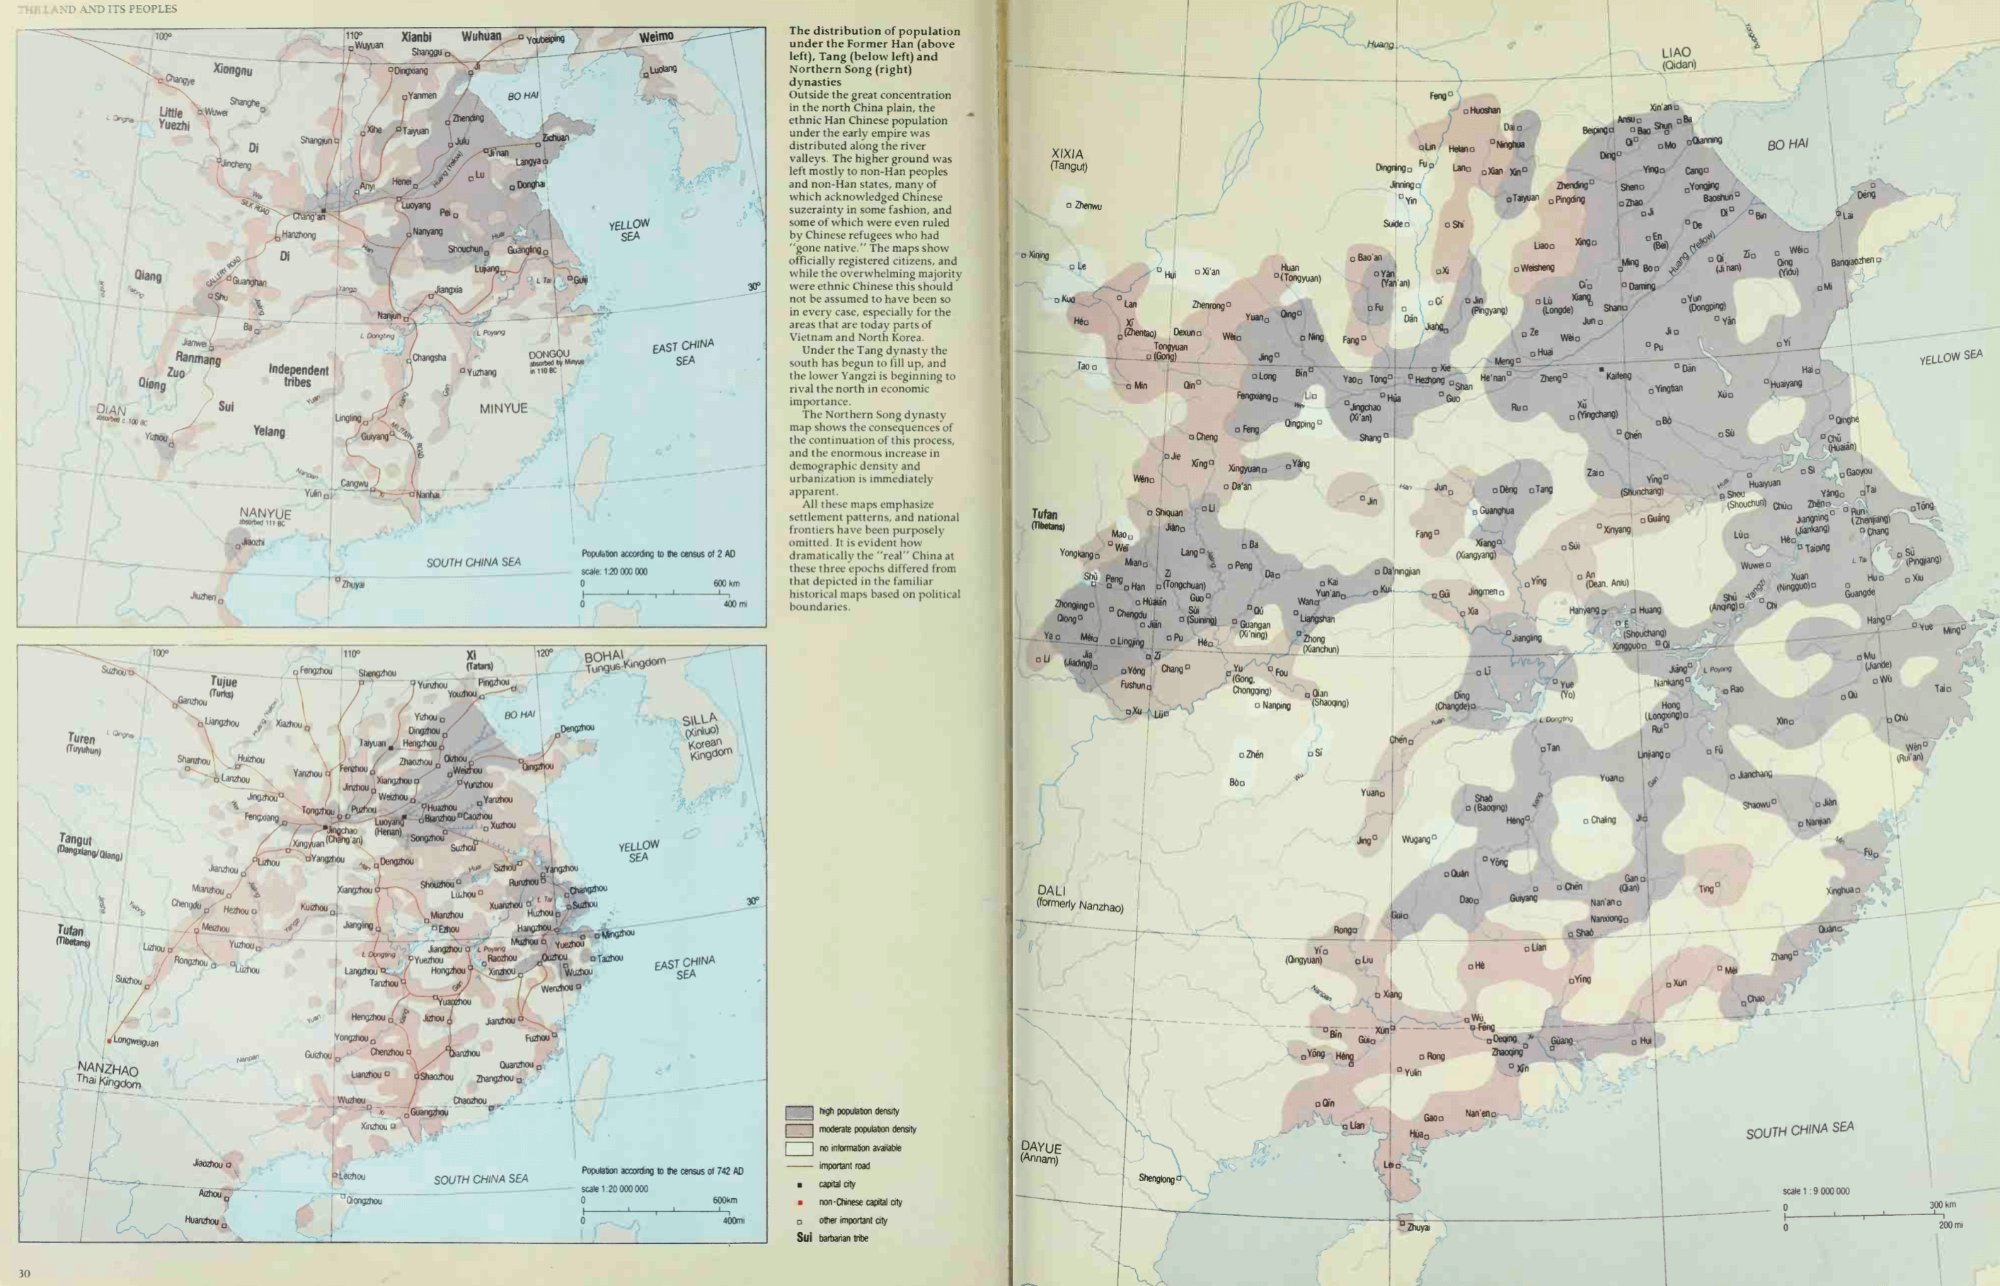
By the Han-Rome comparison (~1 AD), the contrast is sharp and precisely measurable. Both empires governed ~60 million people across comparable territory. The Han census heatmap shows density exceeding 200/km² in the Henan/Shandong core with near-zero settlement south of the Yangtze: one overwhelming center. Scheidel's provincial estimates for Rome show six major population centers (Italy ~7M, Greece/Anatolia ~12.5M, Egypt ~5M, Iberia ~6M, Gaul ~6M, N. Africa ~6M), none holding more than a quarter of the total, all separated by water or mountains. By 1000 AD the gap had widened further: Song China had 2.5 times Europe's population, concentrated on a single Grand Canal-linked axis, governed by one fiscal authority extracting 10–17% of GDP.
II. Reference Maps
farming-sites.csv · farming-sites.xlsx · farming-periods-5-6.xlsx (full source documentation)
III. Agricultural Technology: Origin, Adoption, and Impact
The spatial patterns above reflect not just geography but a sequence of agricultural technologies that enabled population concentration and state extraction. A crop or tool is only historically significant when the full chain is in place: domestication or invention, diffusion to a new region, the enabling technologies needed for local adoption, and the institutional context that determines fiscal impact. Wheat arrived in China ~2600 BCE but remained an exotic for two millennia because Chinese cooking centered on boiling and steaming whole grains; only after rotary milling technology developed in the Warring States/Han did wheat become a taxable staple. The table below tracks these chains.
Table A: Crop & Agricultural Technology Timeline (China-focused)
| Date | Development | Enabling tech required | When impactful | Population / fiscal impact | Sources |
|---|---|---|---|---|---|
| ~8000 BCE | Foxtail millet domestication (Cishan, Peiligang) | None (ground with saddle quern, boiled/steamed) | Immediate | Foundation of Yellow River farming; enabled first permanent settlements in N. China | Crawford 2006; Fuller et al. 2009; Liu 2004 |
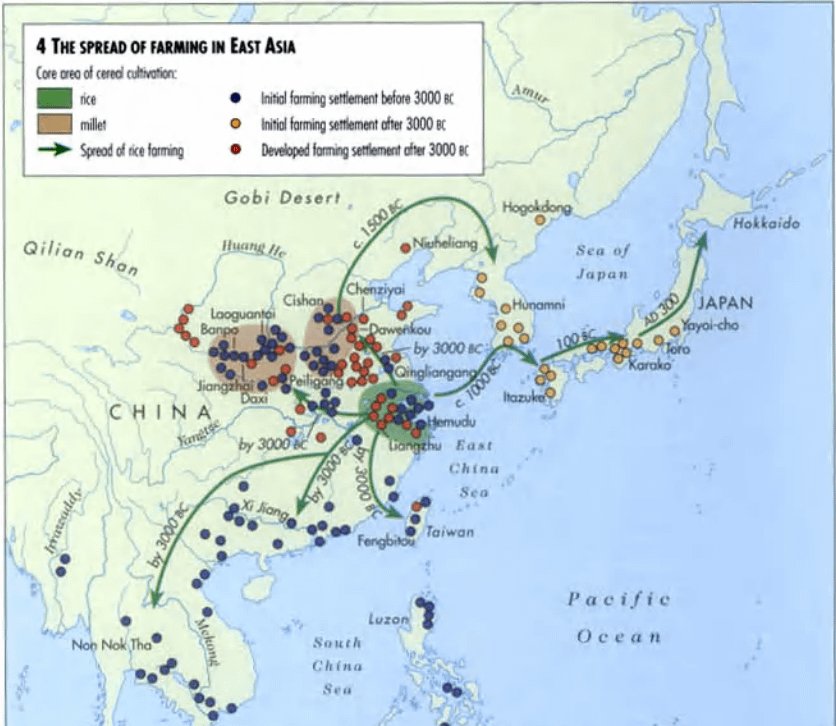
| ~7000 BCE | Rice domestication (lower Yangtze: Kuahuqiao, Shangshan, Hemudu) | Paddy water management (develops gradually over millennia) | Gradual; full paddy systems by ~5000 BCE | Foundation of Yangtze population zone; eventually world's most productive pre-modern crop system | Fuller et al. 2009; Zuo et al. 2017; Fuller 2011 |
| ~8500 BCE | Wheat/barley domestication (Fertile Crescent) | Flour milling: rotary quern (China, Warring States/Han) | Late Han (~1st c. CE); wheat a "staple" only then | Diversified caloric base; winter crop complementing millet. Sat as marginal exotic in China for ~2,000 years because Chinese cuisine was built on boiling/steaming whole grains | Long et al. 2018 (Nature Plants); Guedes et al. 2015; Fuller & Rowlands 2011 |
| ~2600 BCE | Wheat arrives lower Yellow River (as elite exotic via steppe networks) | — | See above | Initially prestige good, not subsistence crop. Contradicts old Silk Road diffusion model (arrived east before west China) | Long et al. 2018 |
| ~6500 BCE | Cattle domestication (taurine, Near East); reaches China by ~3000 BCE | Ox yoke for traction (develops by ~3000 BCE in Near East; Chinese evidence by Shang/early Zhou) | Becomes critical with plough agriculture | Primary traction animal for ploughing until horse collar enabled horse substitution. Ox teams remained standard in China through imperial era | Bollongino et al. 2012; Sherratt 1981; Yuan & Flad 2006 |
| ~3000 BCE | Millet-rice system convergence (Longshan cultural horizon) | Multi-cropping knowledge; storage technology | ~3000–2000 BCE | Created the dual-crop caloric base that single-crop European zones could not match. Enabled Yellow River core demographic dominance | Crawford 2006; Liu 2004; Chang 1999 |
| ~600 BCE | Blast furnace; cast iron production | Bellows technology; high-temperature fuel | Warring States onward | Enabled mass production of iron tools (ploughshares, weapons). Europe did not develop blast furnaces until ~1100 CE | Wagner 2008; Needham SCC IV.2 |
| ~500–300 BCE | Iron ploughshares (Warring States, archaeological finds at Yanxiadu, Huixian) | Cast iron production (see above) | Immediate in Warring States | Opened heavier soils; increased per-area yields; facilitated Warring States population growth and military mobilization | Needham SCC IV.2; von Glahn 2016 |
| ~100 BCE | Full cast-iron mouldboard plough (Han dynasty) | Iron casting; ox traction | Han dynasty onward | Turned soil fully (not just scratched), improving nutrient cycling and weed suppression. Standard across China ~800 years before European general adoption | Needham SCC IV.2; Temple 1998 |
| 256 BCE | Dujiangyan irrigation system (Li Bing, Qin state) | State-organized labor mobilization | Immediate; still functioning | Transformed Sichuan from marginal to major agricultural region. Enabled Qin's resource base for unification wars | Needham SCC IV.3; von Glahn 2016 |
| ~200 BCE | Rotary quern / crank-operated stone mill | Crank mechanism (Chinese innovation) | Western Han onward | Enabled wheat flour processing, transforming wheat from exotic to staple. Foundation of noodle/mantou culinary tradition | Needham SCC IV.2; Wikipedia "Mo (grist mill)" |
| ~2nd c. BCE | Seed drill (耧车 louche) | Iron components; animal traction | Han dynasty | Planted seeds at uniform depth in rows, increasing germination rates and enabling systematic weeding. Europe did not adopt seed drills until Jethro Tull (~1701) | Temple 1998; Needham SCC VI.2 |
| ~5th c. CE | Padded horse collar (Chinese innovation) | Leather/padding materials; harness design | Tang dynasty onward in China | Allowed horses to pull heavy loads without tracheal constriction. ~4× traction efficiency vs. throat-girth harness. Reached Europe ~9th–10th c. | Needham SCC IV.2; Temple 1998 |
| 1012 | Champa rice introduction (state-directed, Emperor Zhenzong) | Existing paddy infrastructure in south | Immediate; rapid adoption | Drought-resistant, fast-maturing, enabled double-cropping. State sent envoys to Fujian to instruct farmers. Underpinned Song population boom (~60M → 120M) | von Glahn 2016; Bray 1984; Deng 2015 |
| 1069–85 | Wang Anshi: 11,000+ irrigation and flood control initiatives | Fiscal resources; bureaucratic capacity (Finance Commission) | Song dynasty | Largest state-directed agricultural infrastructure investment in premodern history. Required the synergistic fiscal state to fund and coordinate | von Glahn 2016 |
| 16th–17th c. | New World crops arrive China (maize, sweet potato, peanut) via private trade | Minimal (adapted to existing farming) | 17th–18th c. (gradual adoption) | Opened marginal upland and sandy soils. Contributed to Qing population boom. Critically: spread via farmer-to-farmer networks, NOT state-directed (contrast with Champa rice) | Mazumdar 1999; Marks 2012 |
Table B: China vs. Europe — Agricultural and Processing Technology Comparison
| Technology | China | Europe | Gap | Key difference | Sources |
|---|---|---|---|---|---|
| Cast iron production | ~600 BCE (blast furnace, Warring States) | ~1100 CE (earliest blast furnaces) | ~1,700 yrs | Chinese state-supported foundries (Han: 48 state iron offices). Europe relied on wrought iron/bloomeries until late medieval period | Wagner 2008; Needham SCC IV.2 |
| Iron mouldboard plough | ~100 BCE (full cast-iron, Han) | ~8th–9th c. CE (general adoption, N. Europe; iron mouldboards ~10th c.) | ~800–1,000 yrs | Chinese design eventually reached Europe via Dutch traders c. 1700 ("Rotherham plough"). European heavy plough required 4–8 ox teams; Chinese plough lighter, single-ox | Needham SCC IV.2; White 1962; Temple 1998 |
| Horse collar | ~5th c. CE | ~9th–10th c. CE (arrives via steppe transmission) | ~400–500 yrs | Europe used throat-girth harness until then, reducing horse pulling power by ~80%. Horse gradually replaced ox for ploughing in 10th–12th c. Europe | Needham SCC IV.2; Langdon 1986; Lefebvre des Noëttes 1931 |
| Seed drill | ~2nd c. BCE (louche 耧车, Han) | ~1701 CE (Jethro Tull) | ~1,900 yrs | Chinese seed drill planted in rows at uniform depth. Europe broadcast-sowed by hand until 18th c., wasting seed and making weeding difficult | Temple 1998; Needham SCC VI.2 |
| Rotary mill / quern | ~3rd–2nd c. BCE (Warring States/Han; crank-operated by W. Han) | ~2nd c. BCE (Roman rotary quern, roughly simultaneous) | ~0 (parallel) | Rare case of near-simultaneous development. Both enabled flour-based cuisines. Roman water mills larger; Chinese crank mechanism more sophisticated | Needham SCC IV.2; Moritz 1958 |
| Paper | ~2nd c. BCE (earliest fragments); ~105 CE (Cai Lun standardization) | ~12th c. CE (first European paper mills, via Islamic transmission) | ~1,000–1,300 yrs | Enabled bureaucratic record-keeping at scale (population registries, tax records, submitted accounts). Islamic world adopted ~8th c. European adoption required watermill infrastructure for pulping | Needham SCC V.1; Bloom 2001 |
| Printing (movable type) | ~1040 CE (Bi Sheng, ceramic type); woodblock from ~7th c. | ~1440 CE (Gutenberg, metal type) | ~400 yrs (movable type); ~700 yrs (woodblock) | Song state promoted printing of agricultural manuals and technical texts. Gutenberg's metal type was more commercially transformative due to alphabetic script (fewer characters needed). Chinese logographic script made movable type less efficient than woodblock for most purposes | Needham SCC V.1; Tsien 1985; Man 2002 |
| Three-field rotation | N/A (China used multi-crop rotation systems, not the European three-field model) | ~8th–9th c. CE (N. Europe) | Not comparable | Different solutions to the same problem. China's rice-paddy system and millet-wheat-legume rotations were regionally adapted. European three-field system (winter grain / spring grain / fallow) was a response to N. European climate and heavy soils. Both increased yields over predecessor systems | White 1962; Bray 1984; Perkins 1969 |
| Gunpowder | ~9th c. CE (earliest formulae); ~10th c. (military application, Song) | ~13th–14th c. CE (military use) | ~300–400 yrs | Diffused via Mongol Empire / steppe corridor. Transformed European warfare and state formation (Tilly thesis) more than Chinese, partly because European interstate competition created stronger adoption incentives | Chase 2003; Andrade 2016; Needham SCC V.7 |
IV. Sources & Methodology
Farming zones on the interactive map are approximate representations based on the sources below. Circle sizes represent relative population/demographic importance at each period, not precise boundaries. Crop type assignments follow the dominant cereal regime; most zones grew multiple crops. The comparison panel figures for 1 AD and 1000 AD draw on actual census data (China) and scholarly estimates (Europe) as noted. For periods 5 (1 AD) and 6 (1000 AD), individual site dots are drawn from geocoded administrative gazetteers: CHGIS V6 for Chinese county seats, Pleiades for Roman-era cities, and Buringh (2021) for medieval European urban populations. The asymmetry in dot counts between China and Europe at 1 AD (1,142 vs 529) reflects both a genuine difference in administrative granularity and uneven Pleiades description coverage. See farming-periods-5-6.xlsx for full selection criteria.