Emperors: Power, Tenure, and Policy Across Imperial China
Ruler Duration (smoothed)
Deposal Rate (smoothed)
Regicide and Ruler Duration: Cross-Civilizational Evidence (Chen & Lin 2026)
The following figures are reproduced from Chen and Lin, "A Quantitative History of Regicide in China," Ch. 4 in Quantitative History of China (Springer, 2026), pp. 65–108. Open access, CC BY-NC-ND 4.0. Subsample B = mainstream emperors from 221 BCE to 1911 CE (excludes fragmentation-era petty kings, who are in Subsample C). European data from Blaydes & Chaney (2013) and Eisner (2011).
I. Three Datasets on Ruler Survival
| Feature | Huang (2023) | Wang (2022) | Chen & Lin (2026) |
|---|---|---|---|
| Book | The Rise and Fall of the EAST | The Rise and Fall of Imperial China | Ch. 4 in Quantitative History of China |
| Publisher | Yale UP | Princeton UP | Springer (open access) |
| Sample (China) | Mainline dynasty emperors only | 249 rulers, 221 BCE–1908 | Subsample B: 341 mainstream emperors, 221 BCE–1911 + Subsample C: 664 non-emperor rulers |
| Fragmentation-era rulers | Interregnum (220–581) collapsed into single obs; Five Dynasties likewise | Included (249 total suggests selective) | Separated into Subsample C |
| Cross-civilizational | Rome only (qualitative) | Europe + Islamic World (Blaydes & Chaney 2013) | Europe (Eisner 2011, Blaydes & Chaney 2013) |
| Method | Dynasty-level averages (1 obs per dynasty) | Individual rulers + smoothed moving averages | 100-year moving average time series |
| Main outcome | Ruler tenure (years) | Deposal rate (binary), tenure | Regicide rate (per 100K ruler-years), tenure |
| Key claim | Ruler tenure increased over time → Keju-driven stability → stagnation | "Sovereign's dilemma": declining deposal rate = rulers traded state strength for personal safety | Chinese regicide rate converges with Europe post-700 AD; no secular trend in ruler duration |
| Replication data | Not public | Harvard Dataverse (doi:10.7910/DVN/KER9GK) | Tables in text; figures only |
II. Dynasty-Level Averages: Huang vs. Wang
The table below compares Huang's stated dynasty averages (from EAST, Ch. 5, pp. 162–63) with averages computed from Wang's individual ruler data (Harvard Dataverse). Differences arise from sample composition: Huang appears to count total dynasty years ÷ number of emperors, while Wang's data records individual tenures that may exclude interregna or co-regencies.
| Dynasty | Period | Huang avg (yrs) | Wang avg (yrs) | Wang N | Wang deposal % |
|---|---|---|---|---|---|
| Qin 秦 | 221–206 BCE | 7 | 6.0 | 3 | 33% |
| W. Han 西汉 | 202 BCE–9 CE | 24 | 17.1 | 14 | 7% |
| E. Han 东汉 | 25–220 | 15.9 | 12 | 17% | |
| Interregnum 三国–南北朝 | 220–581 | 1 obs in t-test | 10.3 | 90 | 40% |
| Sui 隋 | 581–618 | 17 | 16.0 | 4 | 25% |
| Tang 唐 | 618–907 | 19 | 13.8 | 23 | 30% |
| Five Dynasties 五代 | 907–960 | 1 obs in t-test | 9.8 | 23 | 30% |
| N. Song 北宋 | 960–1127 | 28 | 23.2 | 20 | 0% |
| S. Song 南宋 | 1127–1279 | 17.2 | 24 | 21% | |
| Yuan 元 | 1271–1368 | 28 | 8.9 | 9 | 22% |
| Ming 明 | 1368–1644 | 22 | 18.2 | 18 | 0% |
| Qing 清 | 1644–1911 | 36 | 28.7 | 9 | 11% |
III. Does Ruler Tenure Explain Anything?
A. Does Chinese ruler tenure increase over time?
Huang's central empirical claim is that Chinese emperors ruled longer over time, attributing this to the Keju system's pacification of elites. His pre-Sui vs. post-Sui t-test (16 vs. 25 years, p=0.043) is the statistical backbone of this argument (Table 5.1, p. 168).
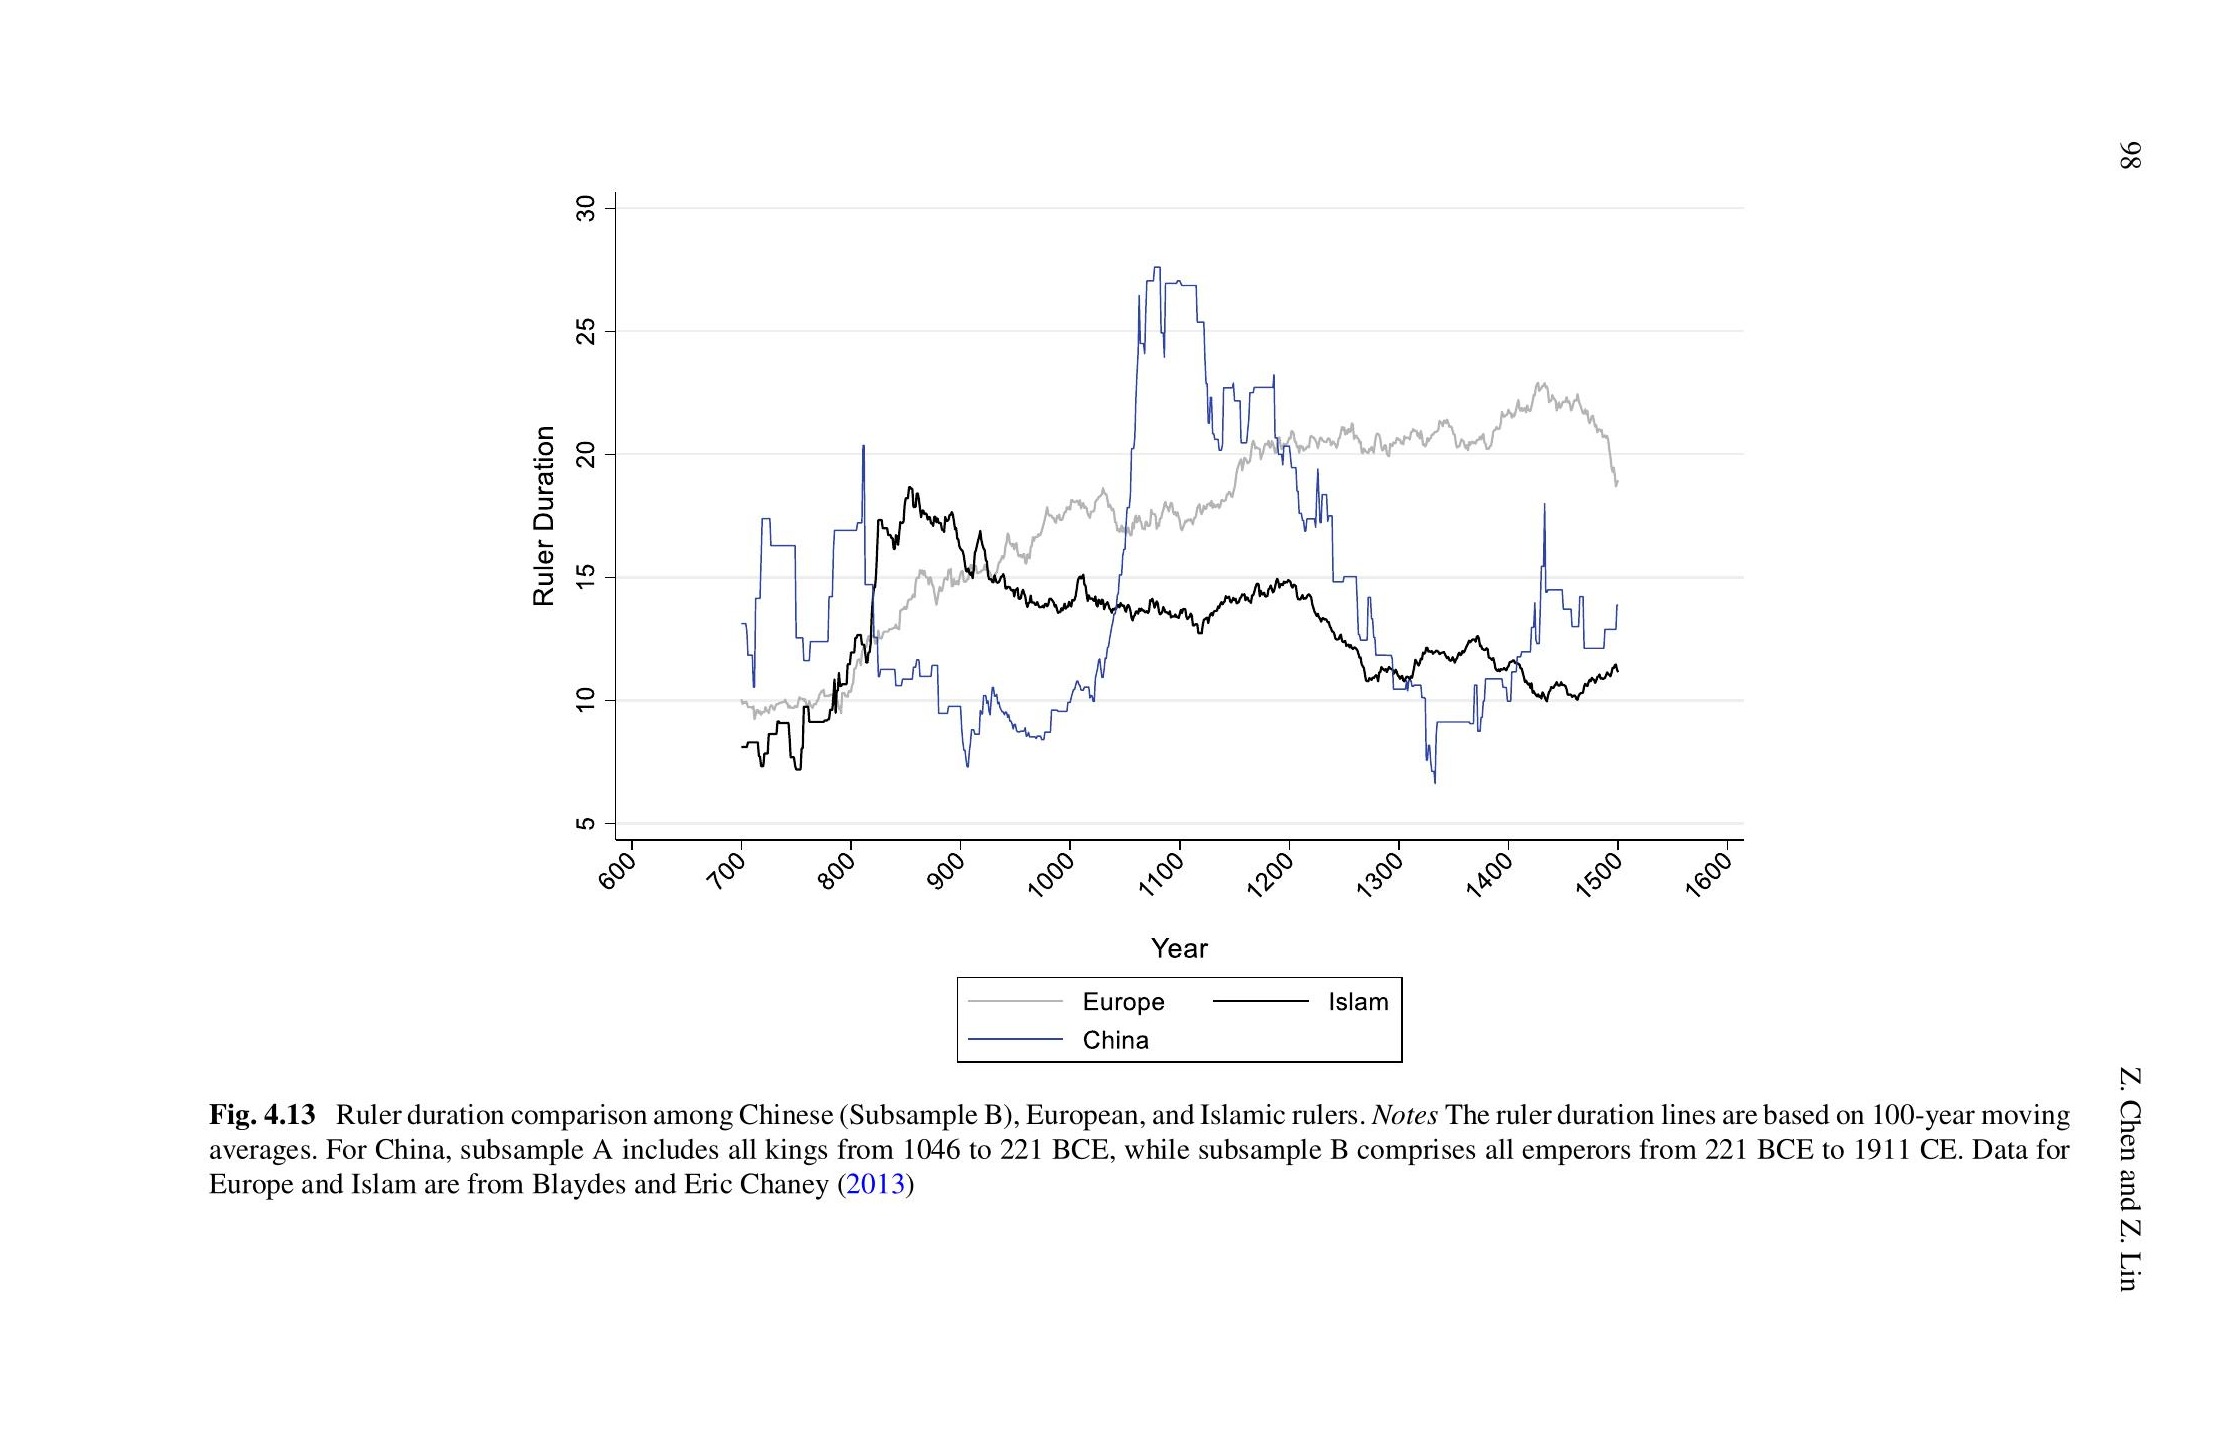
The test has n=13: one observation per dynasty, all within-dynasty variation suppressed. Wang Mang's 16-year usurpation carries the same weight as the 267-year Qing. The result is also fragile to composition. In the pre-Sui group, the Han-Sui Interregnum compresses 361 years and ~90 rulers into one low-average observation that pulls down the pre-Sui mean. In the post-Sui group, Kangxi's and Qianlong's 61-year reigns inflate the Qing dynasty average to 36 years, pulling the post-Sui mean up. Remove the Qing and significance likely vanishes. When Chen & Lin (2026, Fig. 4.13) apply a 100-year moving average to individual ruler data, the upward trend disappears entirely.
There is a further circularity problem: Huang's grouping variable (pre/post Sui) is chosen to correspond to his proposed mechanism (Keju). The cutpoint is the theory. With n=13, moving one observation across the boundary can flip significance.
B. Is China's ruler stability distinctive?
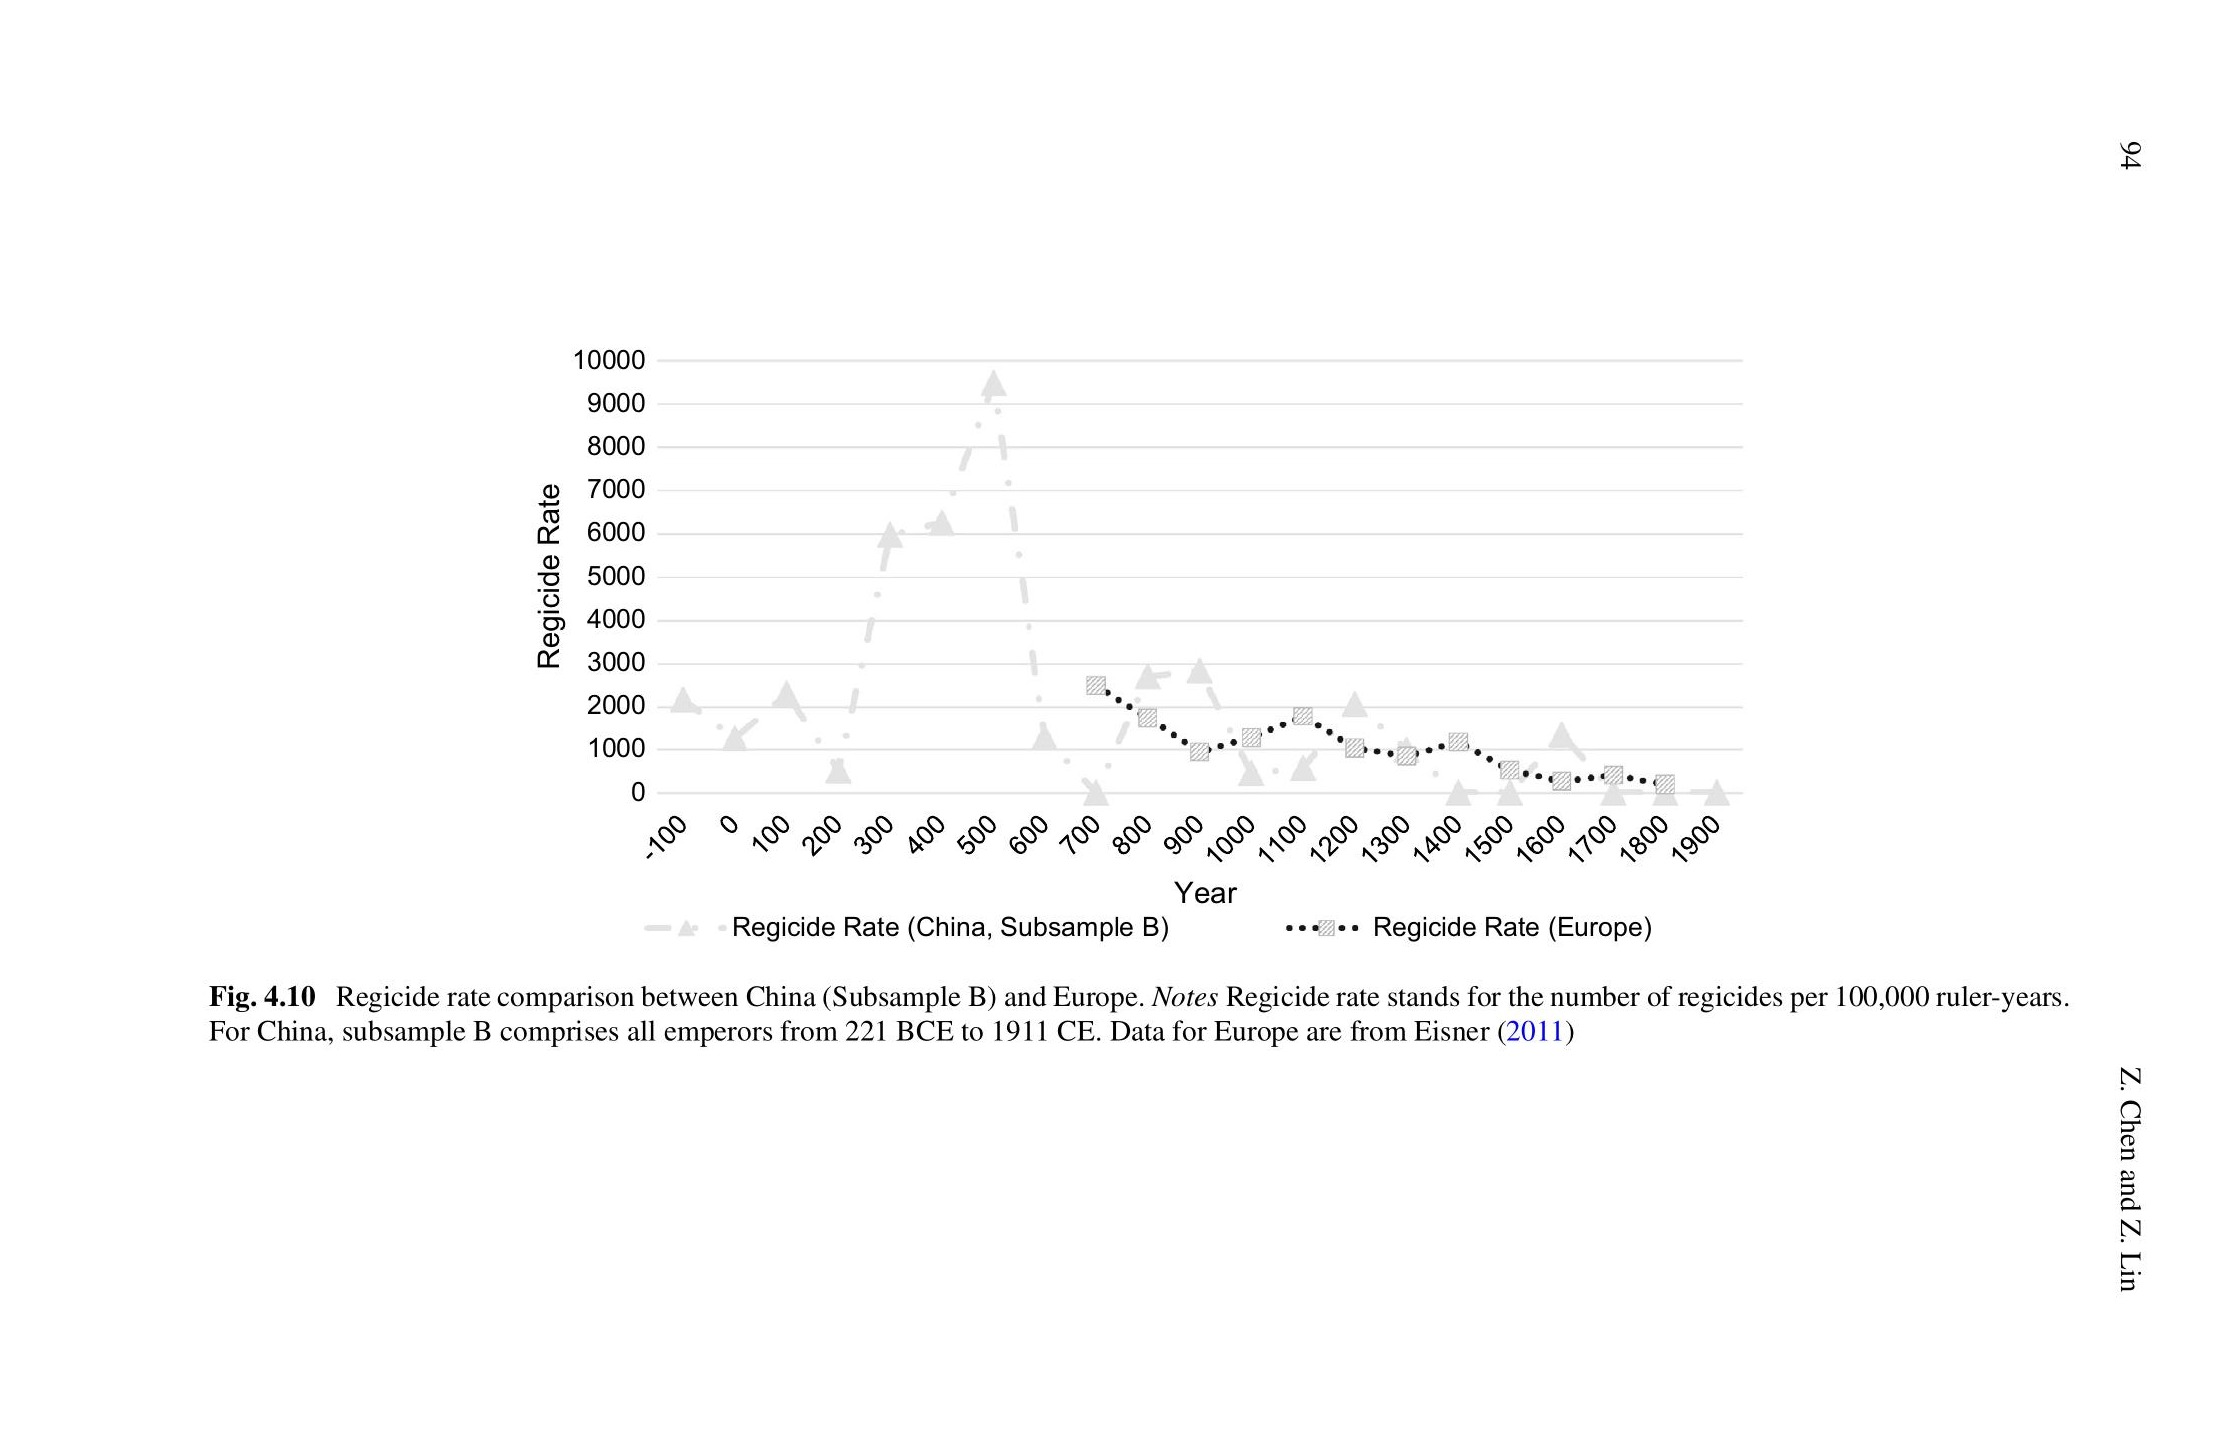
The cross-civilizational comparison shows China and Europe tracking closely on ruler tenure (15–18 years) throughout 1000–1800. The Islamic world is the real outlier, declining from ~16 to ~11 years. Chen & Lin's Figure 4.10 reinforces this: Chinese and European regicide rates converge after 700 AD and decline in parallel toward near-zero by 1800. If increasing ruler tenure caused stagnation, Europe should also have stagnated.
C. Where the data does show Chinese distinctiveness
Wang's deposal rate data reveals the genuine Chinese anomaly. Chinese rulers went from being deposed 55% of the time (c. 1000) to just 20% (c. 1800). European deposal rates declined only modestly (46% → 30%). The question is whether this reflects a deliberate ruler strategy (Wang's "sovereign's dilemma": rulers weakened the state to ensure personal safety) or a byproduct of institutional change (Keju pacified elites and fragmented gentry networks, making coups structurally harder). The fiscal data supports the second interpretation: China's tax/GDP ratio fell from ~17% under the Song to ~1% by the late Qing, but the fiscal decline tracks the localization of elite networks after the Tang-Song transition more than any deliberate policy choice.
IV. Mainline Emperors, Chief Ministers, and What They Believed
Reference table of all mainline emperors from Qin unification through end of Qing, with principal minister/grand councilor where identifiable. Click ★ rows to expand analytical cards with sourced overviews of ideology and policy. Click dynasty headers to expand/collapse. Fragmentation-era rulers omitted; see Chen & Lin (2026) Subsamples B and C.
| # | Emperor | Reign | Yrs | Top Minister / Councilor | VG |
|---|---|---|---|---|---|
| QIN 秦 (221–206 BCE)★ Shi Huangdi | |||||
| ★1 | Shi Huangdi 始皇帝 | 221–210 BCE | 11 | Li Si 李斯 (Chancellor) | MP |
| 2 | Er Shi 二世 | 210–207 BCE | 3 | Zhao Gao 赵高 (eunuch regent) | — |
| 3 | Ziying 子婴 | 207 BCE | <1 | — | — |
| WESTERN HAN 西汉 (202 BCE–9 CE)★ Wudi | |||||
| 4 | Gaozu 高祖 (Liu Bang) | 202–195 BCE | 7 | Xiao He 萧何 → Cao Can 曹参 | MP |
| 5 | Huidi 惠帝 | 195–188 BCE | 7 | Cao Can 曹参 (Empress Lü regent) | — |
| 6 | Wendi 文帝 | 180–157 BCE | 23 | Zhou Bo 周勃 → Chen Ping 陈平 | MP |
| 7 | Jingdi 景帝 | 157–141 BCE | 16 | Chao Cuo 晁错 | MP |
| ★8 | Wudi 武帝 | 141–87 BCE | 54 | Sang Hongyang 桑弘羊 (Comptroller-General) | ME |
| 9 | Zhaodi 昭帝 | 87–74 BCE | 13 | Huo Guang 霍光 (regent) | — |
| 10 | Xuandi 宣帝 | 74–49 BCE | 25 | Bing Ji 丙吉 | MP |
| 11 | Yuandi 元帝 | 49–33 BCE | 16 | Shi Xian 石显 (eunuch influence) | — |
| 12 | Chengdi 成帝 | 33–7 BCE | 26 | Wang Feng 王凤 (Wang clan) | — |
| 13 | Aidi 哀帝 | 7–1 BCE | 6 | — | — |
| 14 | Pingdi 平帝 | 1 BCE–5 CE | 6 | Wang Mang 王莽 (regent) | — |
| — | Wang Mang 王莽 (Xin) | 9–23 CE | 14 | (usurper; attempted radical reform) | ME |
| EASTERN HAN 东汉 (25–220 CE) | |||||
| 15 | Guangwudi 光武帝 | 25–57 | 32 | Deng Yu 邓禹 | MP |
| 16 | Mingdi 明帝 | 57–75 | 18 | — | — |
| 17 | Zhangdi 章帝 | 75–88 | 13 | — | — |
| 18 | Hedi 和帝 | 88–106 | 18 | Dou Xian 窦宪 → eunuch faction | — |
| — | Shangdi through Xiandi (106–220): 10 emperors, mostly child rulers under eunuch/consort regent domination. Avg reign 11.4 yrs. | ||||
| FRAGMENTATION: Three Kingdoms → N/S Dynasties (220–589) — ~90 rulers, see Chen & Lin Subsample C | |||||
| SUI 隋 (581–618) | |||||
| 29 | Wendi 文帝 (Yang Jian) | 581–604 | 23 | Gao Jiong 高颎 → Yang Su 杨素 | MP |
| 30 | Yangdi 炀帝 | 604–618 | 14 | Yuwen Shu 宇文述 (Grand Canal, Korea campaigns) | — |
| TANG 唐 (618–907)★ Taizong · ★ Dezong | |||||
| 31 | Gaozu 高祖 (Li Yuan) | 618–626 | 8 | — | — |
| ★32 | Taizong 太宗 | 626–649 | 23 | Fang Xuanling 房玄龄 / Du Ruhui 杜如晦 / Wei Zheng 魏征 | MP |
| 33 | Gaozong 高宗 | 649–683 | 34 | Zhangsun Wuji 长孙无忌 → Empress Wu influence | — |
| — | Wu Zetian 武则天 (Zhou) | 690–705 | 15 | (ruled directly; expanded Keju) | — |
| 34 | Xuanzong 玄宗 | 712–756 | 44 | Yao Chong 姚崇 → Song Jing 宋璟 → Li Linfu 李林甫 → Yang Guozhong | — |
| ★35 | Dezong 德宗 | 779–805 | 26 | Yang Yan 杨炎 (Two-Tax Reform, 780) | —→ |
| — | Shunzong through Aidi (805–907): 13 emperors, mostly under eunuch domination. Avg reign 7.8 yrs. Huang Chao Rebellion (874–884) devastates fiscal infrastructure. | ||||
| FRAGMENTATION: Five Dynasties / Ten Kingdoms (907–960) — ~23 rulers | |||||
| NORTHERN SONG 北宋 (960–1127)★ Shenzong / Wang Anshi | |||||
| 48 | Taizu 太祖 (Zhao Kuangyin) | 960–976 | 16 | Zhao Pu 赵普 | SY |
| 49 | Taizong 太宗 | 976–997 | 21 | Lü Duan 吕端 | SY |
| 50 | Zhenzong 真宗 | 997–1022 | 25 | Kou Zhun 寇准 → Wang Dan 王旦 | SY |
| 51 | Renzong 仁宗 | 1022–1063 | 41 | Fan Zhongyan 范仲淹 (Qingli reforms) → multiple | SY |
| 52 | Yingzong 英宗 | 1063–1067 | 4 | Han Qi 韩琦 | SY |
| ★53 | Shenzong 神宗 | 1067–1085 | 18 | Wang Anshi 王安石 (New Policies, 1069–85) | ME |
| 54 | Zhezong 哲宗 | 1085–1100 | 15 | Sima Guang 司马光 (reversed reforms) → Zhang Dun (restored) | SY |
| 55 | Huizong 徽宗 | 1100–1126 | 26 | Cai Jing 蔡京 (New Policies revived, corrupt) | — |
| 56 | Qinzong 钦宗 | 1126–1127 | 1 | Li Gang 李纲 | — |
| SOUTHERN SONG 南宋 (1127–1279)★ Gaozong | |||||
| ★57 | Gaozong 高宗 | 1127–1162 | 35 | Qin Hui 秦桧 (peace faction; fiscal fragmentation) | SY |
| 58 | Xiaozong 孝宗 | 1162–1189 | 27 | Yu Yunwen 虞允文 | SY |
| 59 | Guangzong 光宗 | 1189–1194 | 5 | — | — |
| 60 | Ningzong 宁宗 | 1194–1224 | 30 | Han Tuozhou 韩侂胄 → Shi Miyuan 史弥远 | — |
| 61 | Lizong 理宗 | 1224–1264 | 40 | Jia Sidao 贾似道 (land reform attempt) | — |
| — | Duzong, Gongdi, Duanzong, Bing (1264–1279): 4 emperors, Mongol conquest. | ||||
| YUAN 元 (1271–1368)★ Kublai Khan | |||||
| ★62 | Shizu 世祖 (Kublai Khan) | 1271–1294 | 23 | Xu Heng 许衡 (Imperial Academy); Ahmad Fanākati (Finance) | — |
| 63 | Chengzong 成宗 | 1294–1307 | 13 | — | — |
| 64 | Wuzong 武宗 | 1307–1311 | 4 | — | — |
| 65 | Renzong 仁宗 | 1311–1320 | 9 | (restored Keju exams, 1313) | — |
| 66 | Yingzong 英宗 | 1320–1323 | 3 | — | — |
| — | Taiding through Shundi (1323–1368): 5 emperors, increasing instability. Shundi (r. 1333–1368) presided over collapse. | ||||
| MING 明 (1368–1644)★ Hongwu · ★ Wanli / Zhang Juzheng | |||||
| ★67 | Taizu 太祖 / Hongwu 洪武 | 1368–1398 | 30 | Abolished Chancellorship 1380 (after executing Hu Weiyong). No lasting chief minister by design. | PR |
|
Zhu Yuanzhang 朱元璋
Temple: Taizu 太祖 · Era: Hongwu 洪武 · r. 1368–1398 (30 yrs)
Ming founder · PROVIDENTIAL
Leading officials: Li Shanchang 李善长 (Chancellor, executed 1390) · Hu Weiyong 胡惟庸 (Chancellor, executed 1380; triggered abolition of post) · Liu Ji 刘基 / Liu Bowen (chief strategist, d. 1375) · Song Lian 宋濂 (chief scholar-drafter, d. 1381)
Key Sources
Farmer, Edward. Zhu Yuanzhang and Early Ming Legislation: The Reordering of Chinese Society Following the Era of Mongol Rule. Leiden: Brill, 1995.
Dardess, John. Confucianism and Autocracy: Professional Elites in the Founding of the Ming Dynasty. Berkeley: UC Press, 1983.
Dreyer, Edward. Early Ming China: A Political History, 1355–1435. Stanford: Stanford UP, 1982.
Mote, Frederick, and Denis Twitchett, eds. The Cambridge History of China, Vol. 7: The Ming Dynasty, 1368–1644, Part I. Cambridge: CUP, 1988. Chs. 2–4.
Von Glahn, Richard. The Economic History of China: From Antiquity to the Nineteenth Century. Cambridge: CUP, 2016. Ch. 9.
Huang, Ray. Taxation and Governmental Finance in Sixteenth-Century Ming China. Cambridge: CUP, 1974.
Zhu Yuanzhang's political vision was shaped by three formative experiences: peasant destitution under late Yuan misrule, the millenarian violence of the Red Turban rebellions through which he rose, and a deep mistrust of every competing center of authority. The system he built reflected all three. His goal, as Farmer (1995) reconstructs it from the extraordinary volume of early Ming legislation, was a self-regulating agrarian order in which the state provided moral guidance and material security while minimizing the intermediaries who might exploit the population or challenge imperial power. Von Glahn (2016) codes this as "providential": a state that conceived its role as guarantor of popular welfare through direct management of the agrarian economy. The institutional expression of this vision was comprehensive. The abolition of the Chancellorship in 1380, following Hu Weiyong's execution on charges of conspiracy, eliminated the one office capable of aggregating bureaucratic power independently of the emperor. Dardess (1983) shows how the literati who served the founding were systematically subordinated: useful as administrators and ritual specialists, dangerous as an autonomous political class. The lijia 里甲 system organized the rural population into self-governing units of 110 households responsible for tax collection, labor service, and mutual surveillance. The Yellow Registers (huangce 黄册) and Fish-Scale Registers (yulin tuce 鱼鳞图册) created interlocking population and land cadastres intended to make the tax base legible to the center without relying on local elite intermediaries. The weisuo 卫所 military colony system assigned hereditary soldier-farmer households across the empire, designed to sustain a massive army at minimal fiscal cost. The maritime prohibition (haijin 海禁) restricted overseas trade to managed tributary channels. The system's ambition was also its weakness. As Huang (1974) demonstrates for the sixteenth century, the fixed tax quotas (shu'e 税额) established under Hongwu meant that Ming revenues never kept pace with subsequent economic growth, particularly the commercialization of the mid-Ming. The abolished chancellorship created a vacuum that the Grand Secretariat (neige 内阁) eventually filled, but with responsibility and no formal authority, producing the characteristic Ming pattern of grand secretaries who wielded enormous de facto power while remaining institutionally subordinate. The hereditary military system decayed within two generations as soldiers absconded from their registered posts. The lijia system, designed for a static agrarian society, could not accommodate the population mobility and commercial development that accelerated from the fifteenth century onward. Hongwu's institutional design thus defined the parameters within which every subsequent Ming emperor governed, and the rigidities of that design structured the fiscal and administrative crises that later reformers like Zhang Juzheng attempted to address. | |||||
| 68 | Huidi 惠帝 / Jianwen | 1398–1402 | 4 | Huang Zicheng 黄子澄, Qi Tai 齐泰 | PR |
| 69 | Chengzu 成祖 / Yongle | 1402–1424 | 22 | Xie Jin 解缙 → "Three Yangs" begin (Yang Shiqi 杨士奇 etc.) | PR |
| 70 | Renzong / Hongxi | 1424–1425 | 1 | Yang Shiqi 杨士奇 | PR |
| 71 | Xuanzong / Xuande | 1425–1435 | 10 | "Three Yangs" 三杨 (Yang Shiqi, Yang Rong, Yang Pu) | PR |
| 72 | Yingzong / Zhengtong | 1435–1449 | 14 | Wang Zhen 王振 (eunuch); captured at Tumu Crisis 1449 | — |
| 73 | Daizong / Jingtai | 1449–1457 | 8 | Yu Qian 于谦 (defended Beijing) | — |
| 74 | Yingzong / Tianshun (restored) | 1457–1464 | 7 | — | — |
| 75 | Xianzong / Chenghua | 1464–1487 | 23 | Eunuch Directorate expanding | PR |
| 76 | Xiaozong / Hongzhi | 1487–1505 | 18 | Liu Jian 刘健, Li Dongyang 李东阳, Xie Qian 谢迁 | PR |
| 77 | Wuzong / Zhengde | 1505–1521 | 16 | Liu Jin 刘瑾 (eunuch) | — |
| 78 | Shizong / Jiajing | 1521–1567 | 46 | Yan Song 严嵩 (Grand Secretary, corrupt, 20 yr domination) | PR |
| 79 | Muzong / Longqing | 1567–1572 | 5 | Gao Gong 高拱 → Zhang Juzheng begins rise | — |
| ★80 | Shenzong / Wanli 万历 | 1572–1620 | 48 | Zhang Juzheng 张居正 (Grand Secretary 1572–82; Single Whip Reform 1581) | PR |
| 81 | Guangzong / Taichang | 1620 | <1 | — | — |
| 82 | Xizong / Tianqi | 1620–1627 | 7 | Wei Zhongxian 魏忠贤 (eunuch dictator) | — |
| 83 | Sizong / Chongzhen | 1627–1644 | 17 | Multiple (purged Wei faction; unable to stem collapse) | — |
| QING 清 (1644–1912)★ Kangxi · ★ Yongzheng | |||||
| 84 | Shizu / Shunzhi 顺治 | 1643–1661 | 18 | Dorgon 多尔衮 (regent) | PR |
| ★85 | Shengzu / Kangxi 康熙 | 1661–1722 | 61 | Ruled directly. Songgotu, Mingzhu as competing factions. 永不加赋 pledge 1712. | PR |
| ★86 | Shizong / Yongzheng 雍正 | 1722–1735 | 13 | Ruled directly. Created Grand Council (军机处). 摊丁入亩 reform, huohao reform. | PR |
| 87 | Gaozong / Qianlong 乾隆 | 1735–1796 | 61 | Heshen 和珅 (1776–99, unprecedented corruption). Reversed Yongzheng's fiscal decentralization. | PR |
| 88 | Renzong / Jiaqing 嘉庆 | 1796–1820 | 24 | (executed Heshen; White Lotus Rebellion) | PR |
| 89 | Xuanzong / Daoguang 道光 | 1820–1850 | 30 | Mu Zhang'a 穆彰阿; Lin Zexu 林则徐 (Opium War) | PR |
| 90 | Wenzong / Xianfeng 咸丰 | 1850–1861 | 11 | Taiping emergency; Zeng Guofan 曾国藩, Li Hongzhang 李鸿章 rise as provincial leaders | — |
| 91 | Muzong / Tongzhi 同治 | 1861–1875 | 14 | Empress Dowager Cixi 慈禧 (regent); Prince Gong 恭亲王; Self-Strengthening Movement | — |
| 92 | Dezong / Guangxu 光绪 | 1875–1908 | 33 | Cixi (regent/power behind throne); Kang Youwei 康有为 (Hundred Days' Reform, 1898) | — |
| 93 | Xuantong 宣统 (Puyi) | 1908–1912 | 4 | Yuan Shikai 袁世凯 (forced abdication) | — |